A few days ago, we just received all the annual outcomes for the six publicly traded self storage REIT's: Global Self Storage (NASDAQ:SELF), Public Storage (NYSE:PSA), National Storage Affiliates (NYSE:NSA), Extra Space Storage (NYSE:EXR), CubeSmart (NYSE:CUBE), and Life Storage (NYSE:LSI). In all that follows, I will be referring to the associated respective Press Releases available here for SELF, PSA, NSA, EXR, CUBE, and LSI. I will also be referring to the Annual Report for PSA, the Corporate Presentation for SELF, and the Financial Supplements for CUBE, NSA, EXR and LSI.
Funds from Operations
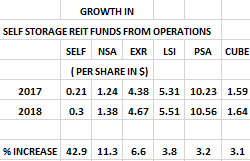
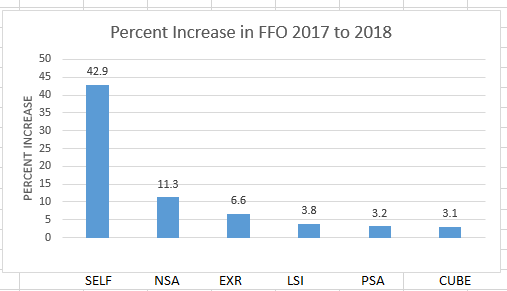
Probably the most crucial comparative dimension (taken from the respective Press Releases) is given below in both tabular and graphic form.
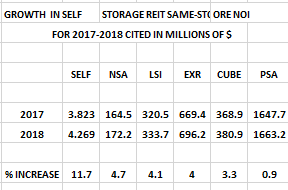
Most striking is the remarkable performance of SELF relative to the industry. Secondarily, there seems to be a negative correlation between entity's size and the growth in FFO. To help understand what may have happened, let us now take an organic approach with a Same Store perspective.
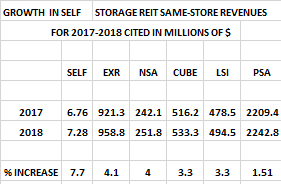
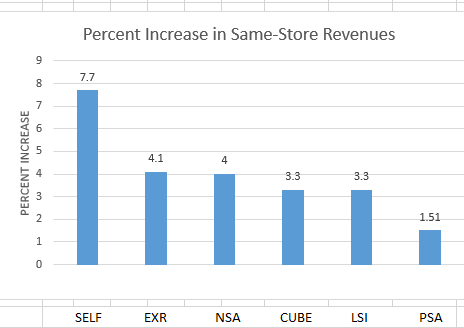
Same Store Revenues
These numbers are taken either from the respective Press Releases and/or the Financial Supplements or Annual Reports.
Same Store Net Operating Income
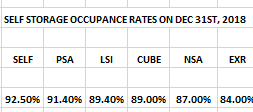
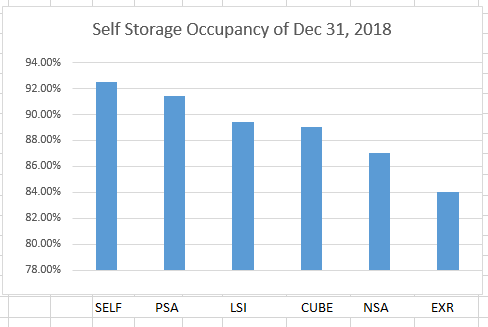
Occupancy on December 31, 2018
The Organic Factor and Responses to Surging Competitive Supply Pressures
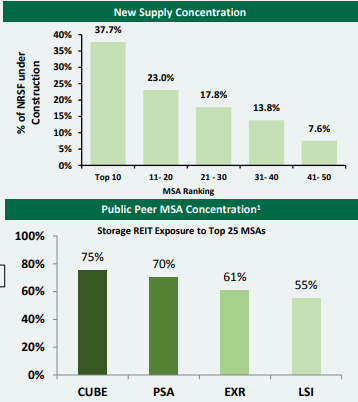
The most prominent present concern for the industry is the continuing development of excessive supply in some of the top MSA markets. Based upon the Same Store data above, PSA seems to be experiencing such pressure. Here is a quote taken from page six of the 2018 Annual Report for PSA: "In the last three years, there has been a marked increase in development of new self storage facilities in many of the markets we operate in, due to favorable economics of development which we have also taken advantage of. These newly developed facilities compete with many of the facilities we own, negatively impacting our occupancy, rental rates and rental growth. This increase in supply has been most notable in Atlanta, Austin,Charlotte, Chicago, Dallas, Denver, Houston, New York and Portland."
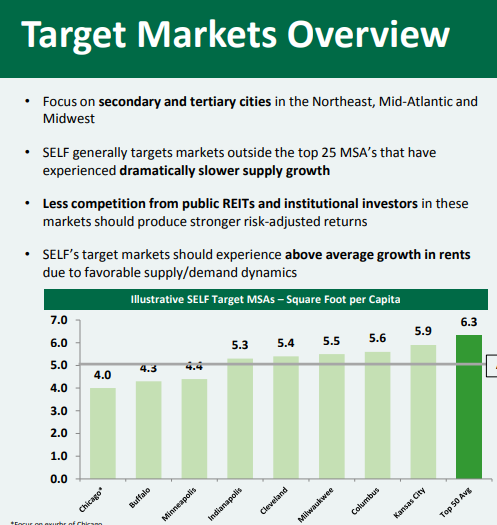
On the other, Mark Winmill, CEO of Global Self Storage writes in the latest Corporate Presentation "We have successfully identified and captured opportunities to grow revenues and NOI by acquiring and expanding our properties in under-served secondary and tertiary cities in the Northeast, Mid Atlantic and Midwest and are continuing to exhibit high barriers to entry through stringent planning and zoning boards."
To illustrate, please see the below images taken from the SELF Corporate Presentation
Undeniably, the larger REIT's, who are locked into head-to-head competitive battles in oversupplied markets, will not be able to perform as well as the much smaller and more nimble Global Self Storage. As a result, the investor in SELF will continue to benefit from future superior rates of growth in Revenue, NOI and FFO.
Implications of the Merrillville Expansion
An addition of 13,300 sq. ft at the Merrillville, Indiana facility was opened on January 1st and was, remarkably, nearly entirely leased-up by the middle of the year. Let's attempt to assess the on-going economic implications for SELF. In the Corporate presentation, we learn that it was 94.7 % occupied on December 31st. At $ 11.70 per sq. ft. (SELF's occupied rate) and at the 2018 margin of 58.8%, we arrive at an annual incremental contribution to NOI of:
13,300 x (11.70) x 0.947 x 0.598 = $ 88123 or 0.0115 per share
Additionally, at an approximate cost of $ 400,000, this investment bears an incremental cap rate of about 22 % (given the reasonable assumptions listed). Such illustrates both prudent evaluation of the local market opportunity, as well as splendid capital allocation. It is an indication of superior management and would likely not have been attainable in a larger REIT, as it required active discernment at the very top.
Now, assuming that this investment became 100 % productive on the very first day of the year, it would account for only 0.0115 of the 0.09 increase in SELF's AFFO. This leaves 0.0785 as attributable entirely to the manner in which SELF operated its existing facilities. Moreover, there were no other acquisitions or expansions during the year of 2018. The logical conclusion embedded in this reasoning is that SELF's AFFO would have increased by 37.4% due to simple operational organic growth!
By the way, the NOI cited above likely translated dollar for dollar into AFFO, since it was funded with cash and would have had negligible impact upon fixed costs.
This is in stark contrast to the numerous 2018 acquisitions and joint ventures boasted by the larger REIT's in their recounts, too many to list. However, you can read all of them for yourself in the Annual Reports. However, as extensive as these augmentations were, the larger REIT's simply came up far short of this industry leader.
In the Press Release, Winmill continues, "In addition to this strategic geographic focus, we maintain as focused as ever in building a higher-quality tenant base, primarily through our strategy of retaining tenants who rent for longer periods and are inclined to accept greater rent increases. In fact, during 2018, we continued to see average tenant duration climb to approximately 3.0 years, a reflection of the success we're experiencing with this strategy."
In reading through corresponding materials of the larger REIT's, I was unable to witness this type of refinement. Perhaps, this is yet another reason for the astounding annual results registered by SELF. Below are related excerpts taken from the Corporate Presentation.
Synopsis
Here we have presented a direct quantitative comparison of respective fundamental economic performances of the six publicly traded self storage REIT's; and we have attempted to provide some perspective regarding to factors that have impacted their 2018 numbers and will likely continue to do do. In particular, we have highlighted the phenomenal 2018 outcomes of Global Self Storage and we have attempted to provide plausible explanations for the stunning growth registered by this industry leader.
Of course, the next logical question becomes, "Growth at what price?" Valuation is the subject of the next article.
Disclosure: I am/we are long SELF. I wrote this article myself, and it expresses my own opinions. I am not receiving compensation for it (other than from Seeking Alpha). I have no business relationship with any company whose stock is mentioned in this article.
Editor's Note: This article covers one or more microcap stocks. Please be aware of the risks associated with these stocks
Related Stocks
| Ticker | Company Name | Market Cap | PE Ratio | Div Yield | 1M Perf |
|---|---|---|---|---|---|
| CUBE | $6.03B | 36.23 | 3.98% | 3.21% | |
| EXR | $13.01B | 31.08 | 3.37% | 2.56% | |
| LSI | $4.49B | 21.73 | 4.14% | -0.43% | |
| NSA | $1.62B | 407.99 | 4.13% | 0.42% | |
| PSA | $38.67B | 25.91 | 3.61% | 1.60% | |
| SELF | $30.69M | 49.10 | 6.52% | 2.84% |
The
distributor of this communication
has been paid by the Company for distribution services to
disseminate Company press releases and articles written
about the Company to the distributor’s
subscribers. The opinions expressed by the distributor in
the foregoing communication are those of the author. They do
not purport to reflect the opinions or views of the Company,
its affiliates, or their representatives. Neither the
Company, nor any of its affiliates or representatives, makes
any representation or warranty, express or implied, as to
the accuracy or completeness of the information contained in
the distributor’s
communication or in any other written or oral communication
transmitted or made available to the recipient by the
distributor hereof. The Company,
and its affiliates and representatives, expressly disclaim
any and all liability based, in whole or in part, on such
information, errors therein or omissions therefrom. This
communication shall not constitute an offer to sell or the
solicitation of an offer to buy the Company’s securities.
A complete disclaimer can be viewed HERE

