
It’s no secret that the self-storage industry has had a nice run in recent years due to strong demand for storage space and a history of resilient cash flows through economic cycles. It’s also widely known that the compelling fundamentals in the segment have attracted the interest from investors and developers that have added a lot of new supply across most major metro areas to meet the growing demand. There are various sources of free research online that highlight these trends. I’ll refrain from rehashing and skip to an overview of the self-storage segment, and where I see value today.
FFO Growth and Stock Performance
The increase in supply and ensuing competition for tenants has started to show in the performance of the self-storage REITs. The table below shows the strong FFO growth rates realized in 2015-17 that have tapered over the last 12-18 months. National Storage Association (NYSE: NSA) stands out in this regard with FFO growth well in excess of 10% since 2016. Global Self Storage (NASDAQ: SELF) has also experienced strong growth since 2017 but had a down 1Q 2019 due to operating expense escalations outpacing revenue increases (more on this below).
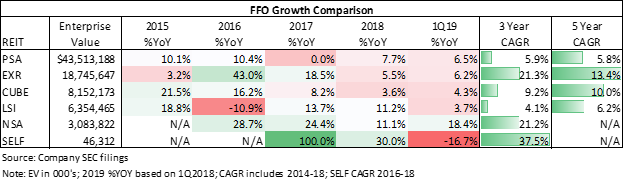
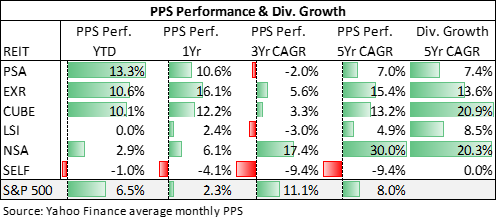
The table below shows the performance of self-storage stocks compared to the S&P 500 since 2015 using monthly average share prices. Extra Space (NYSE: EXR), CubeSmart (NYSE: CUBE), and NSA have outperformed the S&P 500 over the last 5 years. Life Storage (NYSE: LSI) and Public Storage (NYSE: PSA) have underperformed, and SELF has had a rough run since its mid-2016 highs. The outperformance of EXR, CUBE, and NSA is consistent with their strong FFO and dividend growth. In more recent months the larger players have outperformed both the smaller peers and the S&P 500. This may imply that investors prefer larger scale and lower leverage in a more uncertain market environment.
Valuation Comparison
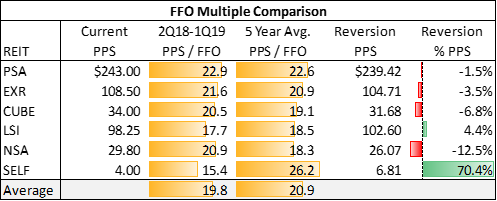
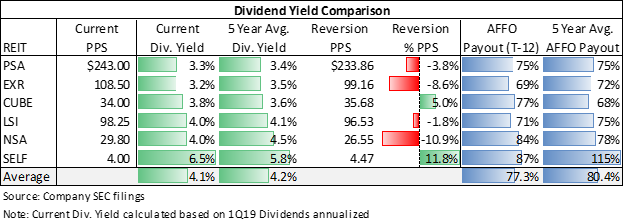
In addition to FFO and dividend growth, a few other metrics that I'm watching to track valuations in this segment are FFO/PPS multiples, dividend yield, and dividend safety measured by the AFFO Payout ratio. The average PPS/FFO of the six REITs is 20.9 based on average monthly share prices and has remained in the 18-21x range over the last 5 years (excluding SELF which traded at a 50x multiple in 2016). SELF is the only stock trading materially below its 3-year average of 18.6x (excluding 2016). Assuming the stock traded at 18-20x FFO, consistent with its larger counterparts the implied value today is in the $4.75 to $5.25 range, or 20%+ increase from its current ~$4.00 levels.
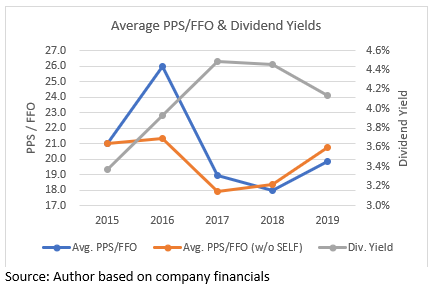
Dividend yields in the segment hang around the low 4% range. Similar to PPS/FFO multiples, the current yields all look to be in-line relative to historical levels except for SELF, which is trading 70bps above its historical average and 250bps above the nearest peer (NSA). Assuming the stock reverts to its historical 5.8% yield the implied valuation of SELF is 10%+ above the current price.
A Closer Look at SELF's Underperfomance
Tverage of 30%, and 46% for NSA.
wo possible explanations for SELF’s underperforming share price relative to its peer group are scale and a sustainable growing dividend.
Scale matters and SELF is tiny compared to its peers. SELF has an enterprise value that is 1.5% of NSA, and 0.1% of PSA. The statistics are similar when calculated based on rentable square feet. Smaller firms trading at discounts to larger peers makes sense in uncertain market environments when capital becomes scarcer. These larger players have access to credit markets, lower cost of capital, and geographic diversification. The stock returns of PSA, EXR, and CUBE during the last 6 months provide a nice illustration of this flight to safety (table above).
Contrarily, SELF’s smaller size and concentration in supply insulated markets has contributed to vastly higher revenue (SELF Investor Presentation) and FFO growth over the last 3 years compared to the peer group. SELF is also well capitalized with over $3MM of liquid assets on the balance sheet and a recently secured $10MM credit revolver for funding expansions and new acquisitions. The +$13MM of combined cash and credit capacity represents significant investable funds relative to its $46MM enterprise value. SELF’s Debt / EV is 40% compared to the peer a
SELF’s portfolio is in tier II and tertiary markets in the Northeast, Mid-Atlantic, and Midwest. These MSA’s have not experienced market moving supply increases this cycle mainly due to lower rental rates that don’t support the juicy development yields that tier I markets offer. PSA, EXR, and CUBE have a higher concentration of their portfolios in Top 25 MSA’s and have average rental rates in the mid-teens per square foot compared to an average of $11-12/sf across the SELF portfolio. SELF’s positioning in non-core markets with strong demographics has provided rate growth that is on par or above tier I markets, but with insulation from supply increases, the biggest risk to future performance in self-storage.
Dividend safety and growth potential warrants a premium valuation and SELF has the lowest dividend safety as measured by AFFO Payout in the peer group; 87% versus the 77% segment average. The market could be pricing the risk of a dividend cut into the SELF share price. Due to higher than expected real estate taxes and store level payrolls SELF’s AFFO was flat in 1Q19 compared to 1Q18. The rest of the peer group grew AFFO by an average of 6% during the quarter.
Despite the Q1 blip SELF has generated AFFO of $0.30/share over the last 4 quarters, covering the dividend of $0.26/share. Additionally, SELF grew revenues by 7.4% with gains in occupancy, rental rates, and lengthening average duration tenant stay. The flat AFFO growth was driven by two items: (1) loss of a Class 8 tax status at the Dolton, IL property resulting in a 23% real estate tax increase, and (2) store level payroll expenses growing at 10% over 1Q18 compared to 6.4% inflation in 2018. As a result of these expense items, operating expenses grew by 9.6% and net operating income was down on the quarter. Management expects real estate taxes to normalize at the current levels going forward and existing rent increases in 2019 to be slightly below the 7.3% annual growth realized in 2Q-4Q of 2018.
Normalized real estate taxes plus payroll expenses closer to 2018 escalations, combined with rental revenue growth in the 5-7% range through the end of the year should result in modest FFO growth in the mid-single digits for 2019, and strengthening of the payout ratio.
Valuation & Growth
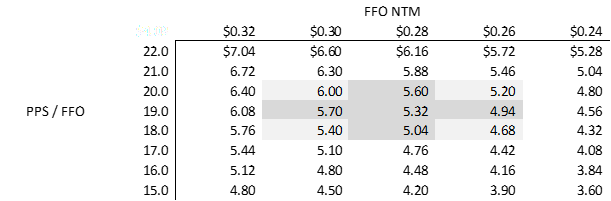
FFO Multiple
SELF has continued to grow revenue through consistent increases in occupancy, rate, and average tenant stay duration. Couple the positive operating trends with normalizing real estate tax increases, and FFO is poised to outpace 2018 performance in coming quarters. Achieving a modest 5% annual increase of FFO in 2019 will increase dividend coverage and justify a PPS/FFO multiple in the 18-20x range, implying a fair value of $5.00 to $5.50, or 25%+ upside from current levels.
Private Market / Liquidation Value
There was a recent article posted on this site (here) that looked at SELF’s valuation in the private market and determined that at a 7.5-9.0% cap rate the real estate assets could be liquidated for $53,000,000 to $63,000,000 giving the equity a value of $4.38 to $5.75 per share. I agree with this logic and consider the lower end of this range to be my valuation floor that serves as a downside margin of safety.
Millbrook, NY Expansion Upside
Management is pushing forward with the 16,500 square foot expansion of the Millbrook, NY location. The additional space is planned for 100% climate-controlled units. Construction is expected to commence in 1H2019 and take 6-9 months to build. Management hasn’t given guidance on expected construction costs, but there is a required $900,000 payment to Tuxis (previous owner) due at construction commencement per the 2016 purchase agreement. The cost of the project will be funded with the credit revolver.
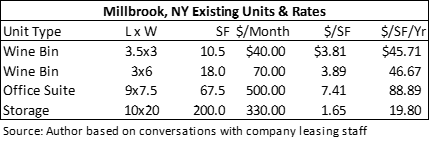
We don’t know the project budget, but we do know that the Millbrook property gets very strong rates and runs at 90%+ occupancy. The table above shows the existing unit types at the Millbrook location and the corresponding rates. I called this morning and was told the office suite and 10x20 storage units are 100% occupied. Assuming the new facility stabilizes to 90% occupancy at the conservative $20/sf average rate then the incremental revenue should be upwards of $300,000 per year. At a ~60% NOI margin the space will generate $180,000 of NOI. The expansion space will likely achieve a higher margin due to scaling property level fixed costs across more rentable space. Without knowing the development costs, napkin math suggests that the project can support an all-in budget of $1,800,000, or $110/sf, and stabilize to a 10%+ cap rate. Deducting the payment to Tuxis leaves $55/sf of development dollars for planning and construction, which should be enough to build a two-story facility of similar quality to the existing building. Management is following up the Merrillville expansion with another value accretive project.
The expenses associated with development and stabilizing the space will be dilutive to FFO in the near term, but the incremental NOI will be value accretive to FFO once stabilized. I estimate an additional $0.015 to $0.025 FFO/share depending on permanent financing.
Conclusion
The self-storage REITs have performed well through varying economic environments due to resilient demand for storage space, and until recently, a shortage of space to meet the demand. The increases in supply across many markets has started to pressure rent growth across the sector. Despite the tapering of rent growth, the larger self-storage REITs have performed well relative to the broader market, except for SELF. Despite SELF’s limited scale and lower dividend coverage, the company is well positioned in high barrier to entry markets, is experiencing stronger top line growth than its peers, is well capitalized for growth, and is unlocking additional value through expansion projects on owned assets. Additionally, the company is currently valued at a 9%+ cap rate on 1Q2019 annualized net operating income, which represents a healthy discount to liquidation value. SELF represents a compelling value at current levels. My targeted value range is $4.50 to $5.50. Potential catalysts include: (1) progression on development timeline for Millbrook expansion, (2) normalizing of operating margin after expense increases in 1Q19, and (3) growth through acquisitions.