
The New Year begins with the hype of great gains continuing for shares of Apple (NASDAQ:AAPL) in 2018. Many analysts say that new iPhone features are on the way, but have not explained their expectations. Raising price targets to $200, $215 and $235 are not justified given a P/E ratio of 18.37.
In my opinion, Apple will cut the price of the iPhone X, fix the battery issues on older iPhones and surprise investors with a special dividend. These are the reasons to maintain a core long position in shares of Apple.
Apple closed Wednesday at $172.23 in bull market territory, 50.1% above its 52-week low of $114.76 set on Jan. 3, 2017. The stock is just 2.8% below its all-time intraday high of $177.20 set on Dec. 18.
The daily chart for Apple
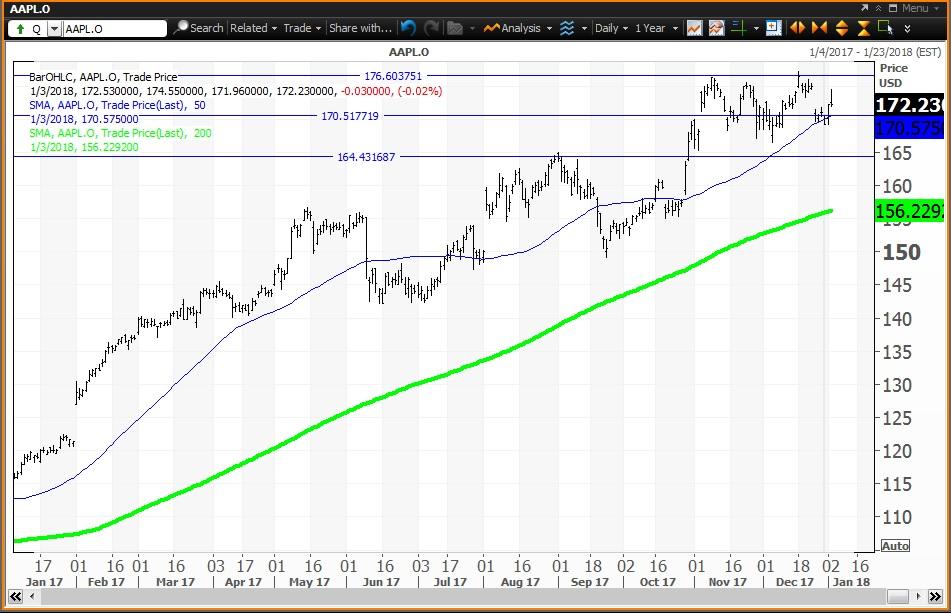
The daily chart shows that Apple has been above a ‘golden cross’ since Sept. 6, 2016 when the stock closed at $107.70. A ‘golden cross’ occurs when the 50-day simple moving average rises above the 200-day simple moving average indicating that higher prices lie ahead. Note how the stock has been tracking its 50-day simple moving average higher since June 9.
The horizontal lines on the chart are my first quarter 2018 value level of $164.46, my first half 2018 pivot of $170.50 and my annual pivot at $176.57.